
California’s Billion-Dollar Home-Health Mystery
The SEIU-UHW’s recruitment backbone is full of red flags
California’s home-health boom is wrapped in mystery. Firms are billing Medicare billions, with some growing 800x. Meanwhile, the state’s patient population has barely grown, the home-health sector has declined nationwide, and many top billers have almost no online traffic. 1
California’s Outsized Home-Health Agency Growth
Change since 2019
Home-health providers need little to no certification, training, or technology. This made it one of the easiest ways for California’s unions, such as the SEIU-UHW, to recruit and deploy entry-level members. The politically connected union is the largest spender on many political issues while one of its major sources of revenue growth remains hidden from the public.
Agencies who first appeared after 2019 billed Medicare $1.07 billion in 2024. That was 33% of payments published for California that year. Nearly 40% of those payments went to addresses in Glendale, Burbank and Van Nuys. 2
Extreme Home-Health Billing Growth3
Sea Coast
BLC / Careway
Preferred Choice
Archer / Optimal
At Therapeutic Home Healthcare in Fresno, annual Medicare payments stayed below $400,000 for six years. In 2022, they jumped to $3.35 million, reaching nearly $5 million by 2024. Therapeutic was one of seventeen California providers whose published Medicare payments increased by more than 1,000% between 2019 and 2024. Their combined payments rose from $2.8 million to $75 million. 3
Therapeutic Home Healthcare’s Medicare payments3
- 2016: $380,588; 107 Medicare patients.
- 2017: $292,698; 87 Medicare patients.
- 2018: $197,325; 60 Medicare patients.
- 2019: $218,529; 74 Medicare patients.
- 2020: $280,977; 51 Medicare patients.
- 2021: $316,201; 65 Medicare patients.
- 2022: $3,352,094; 807 Medicare patients.
- 2023: $4,427,667; 979 Medicare patients.
- 2024: $4,992,198; 982 Medicare patients.
BLC Homehealth’s Medicare patient count rose from 17 to 1,289 during that same time interval. Payment per patient rose about 12%. 3
At Sea Coast, patient revenue rose 8% from 2023 to 2024, while operating expenses fell 36%. That lifted patient service income from $412,000 to $2.56 million. Sea Coast’s reported patient-service margin went from 8% to 46%. 4
Sea Coast’s patient service income rose sixfold4
Operating expenses
Patient service income
In October 2017, CDPH announced a major change to its state licensing program. If home-health agencies passed a private survey, CDPH would issue a six-month provisional state license. 5
CDPH reported waits of three months to two years for initial home-health licensing surveys in October 2017. Its alternative allowed applicants to hire an approved organization to conduct the state-licensing survey and send the findings to CDPH. 6
One accreditor warned CDPH that a prospective hospice used a fabricated address, but CDPH issued a license anyway. 7 California does not disclose which agencies were initially approved using private auditors.
Los Angeles County described two obstacles to following a complaint through the system: inspectors needed CMS authorization to conduct a complaint-validation survey at those agencies and received no information about case outcomes once federal fraud investigators took over. 5
L.A. County’s complaint process
CMS
Approves survey
County inspectors
Conduct survey
Federal investigators
Take over fraud case
County follow-up
No outcome shared

Federal regulators are starting to act. In May 2026, CMS announced a six-month nationwide freeze on new home-health and hospice enrollments and certain changes in majority ownership. CMS said it had suspended payments to approximately 800 Los Angeles home-health and hospice providers on suspicion of fraud.
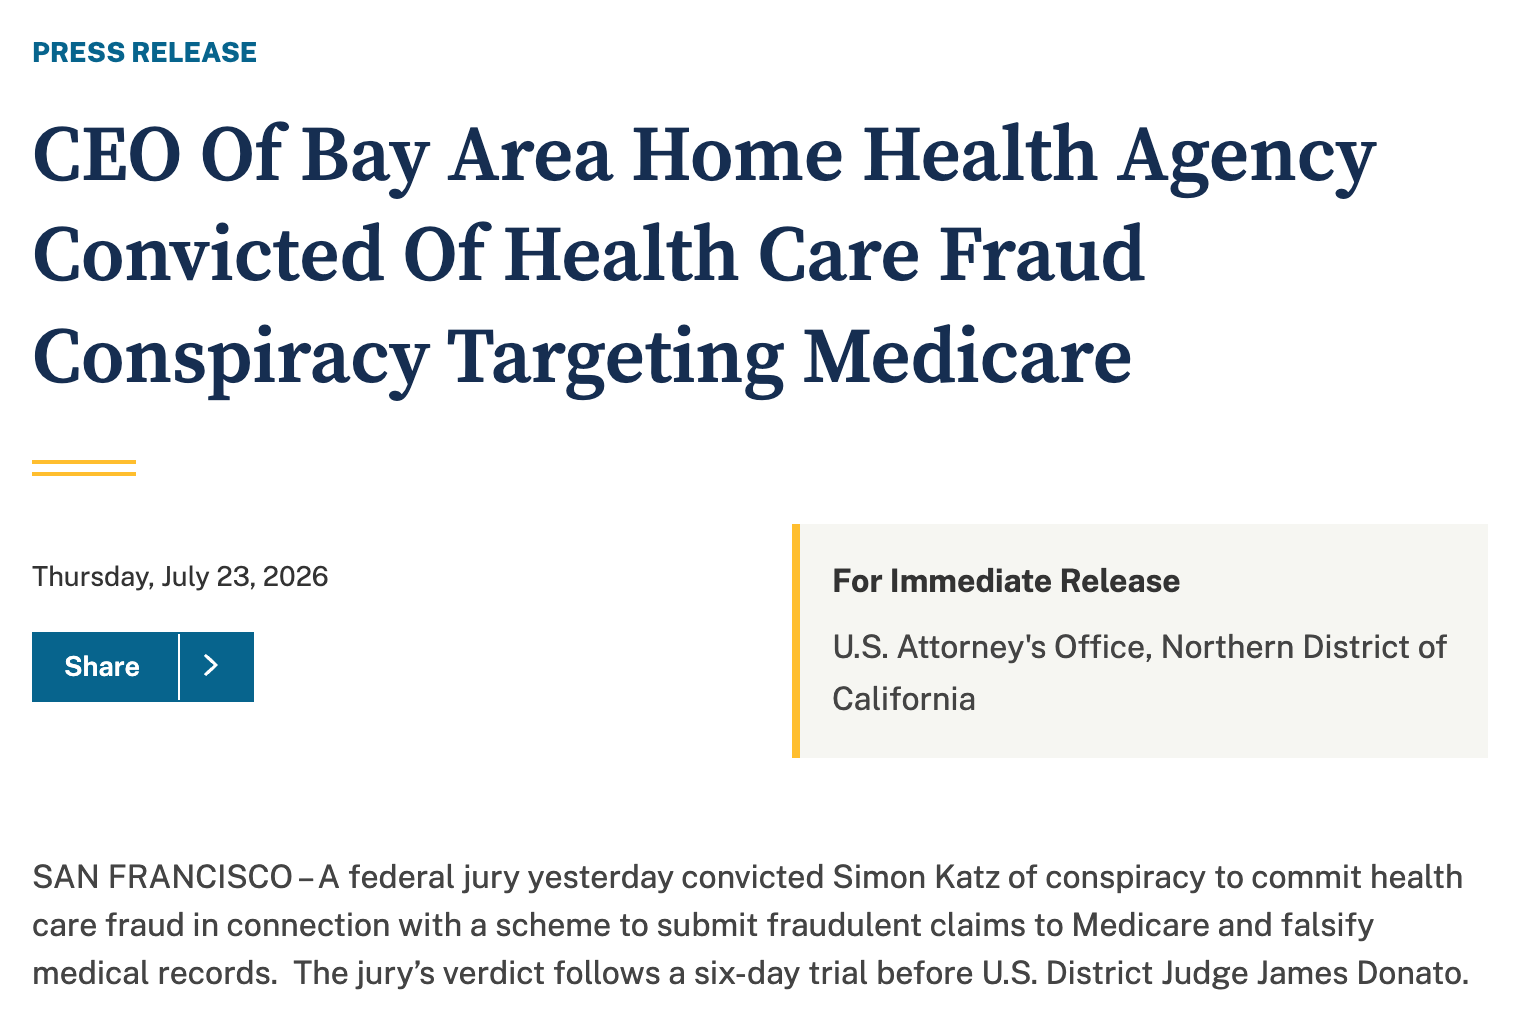
In July 2026, a jury convicted HealthNow’s Simon Katz of a health-care-fraud conspiracy. The Justice Department described claims for services never provided and clinical work performed by unqualified personnel.
In April 2026, the California attorney general announced charges against 21 suspects in an alleged $267 million Medi-Cal billing scheme involving 14 hospice companies. Prosecutors said the operation used stolen identities and straw owners to bill for services never provided.
In June, federal prosecutors announced a separate conspiracy case against Oren David Shachar, Jeannie Choi and Abraham Shin. The indictment alleges that four hospice businesses submitted $27.7 million in claims, receiving $26.9 million, through a scheme involving kickbacks and patients who were ineligible for hospice care or already dead.
In August, Lynn Galbraith, who operated Azure Hospice Care in Garden Grove, pleaded guilty to health-care fraud. The Justice Department said she submitted more than $2.2 million in false hospice claims and received about $2.1 million for services involving patients who were ineligible for the benefit.
DOJ Health Care Fraud Unit trials, calendar years 2018–20258
California’s home-health industry is a representative example of how California became structurally vulnerable to fraud. Verification is delegated. Transparency is limited. It’s a staggering pattern that does not replicate across the country. Authorities often do not have the information to detect fraud to begin with, instead relying on retroactively demanding records which may not be preserved. The State of California has not shown any interest in policies which prevent fraud and has frequently changed policies to make fraud easier.
Footnotes
Agency and patient growth. CMS 2019 and 2024 files; annual series and calculations. Agency counts use published provider IDs; patient counts use state totals. Outside California includes D.C. and Puerto Rico. California added 906 agencies, including 480 in 2022–24. These fee-for-service files exclude Medicare Advantage.
Newer providers. Provider cohort, CMS source and calculation: $1.068 billion ÷ $3.255 billion in published California provider payments = 32.8%. Glendale, Burbank and Van Nuys account for 39.1% of cohort payments. “Newer” means first observed in the 2016–24 files; identifiers can change independently of business formation.
Online presence and traffic analysis. September 14, 2026 business-presence analysis, audience-evidence column. The sample comprises the twenty largest recorded absolute billing increases across Medicare payments, submitted charges and selected Medicaid company codes, 2019–24.Providers in the online-presence analysis Data Healthflex Home Health Services payment 27,642,984 228.7% - Rank
- 1
- Provider or office
- Healthflex Home Health Services
- Legal identity
- HEALTHFLEX HOME HEALTH SERVICES
- Provider ID (CCN)
- 059551
- NPI
- 1326399296
- City
- Oakland
- Measure
- payment
- Baseline year
- 2019
- Final year
- 2024
- Baseline value
- 12088508.0
- Final value
- 39731492.0
- Increase
- 27642984.0
- Growth (%)
- 228.6716
- Domain
- healthflex.com
- Sales evidence
- Nursing, aides and therapy are marketed to referring clinicians; “Refer Today” leads to a patient inquiry form.
- Operations evidence
- Oakland office and telephone match the registry. Careers link to a Paylocity recruiting portal.
- External evidence
- HPSM lists the exact NPI. SFBT published company-wide reported revenue of $17.87m in 2019 and $38.25m in 2021. | CMS 2025 patient survey: 346 responses, 19% response rate.
- Events evidence
- Charitable support is described without dated participation details; specific participation dates remain unverified.
- Audience evidence
- Indexed Semrush estimate: 2,288 monthly visits, updated June 18, 2026, for the whole domain. Live detail page: HTTP 403; Google volume unavailable.
- Overlap
- False
- Overlap type
- —
- Evidence sources
- https://npiregistry.cms.hhs.gov/api/?number=1326399296&version=2.1
- https://healthflex.com/providers/
- https://healthflex.com/locations/oakland/
- https://healthflex.com/careers/
- https://healthflex.com/patient-stories/
- https://www.hpsm.org/docs/default-source/member-manuals/hpsm_directory_ca-dsnp-2026_202511031017.pdf?sfvrsn=b40907da_19
- https://healthflex.com/about-us/
- https://healthflex.com/patient-inquiry/
- https://eastbayeda.org/wp-content/uploads/2022/12/SFBT_2023_EastBayBOL-web.pdf
- https://www.adminawards.com/wp-content/uploads/2023/11/2023-SFBA-Winners-and-Finalist-Publication.pdf
- https://data.cms.gov/provider-data/sites/default/files/resources/706e7ad48548f6f3893109f403dd9fd8_1782764088/HHCAHPS_Provider_Jul2026.csv
- https://www.crunchbase.com/organization/healthflex-home-health-hospice/tech_details
Best Home Health Providers, Inc. payment 21,566,962 692.9% - Rank
- 2
- Provider or office
- Best Home Health Providers, Inc.
- Legal identity
- BEST HOME HEALTH PROVIDERS, INC.
- Provider ID (CCN)
- 059546
- NPI
- 1144592916
- City
- Hayward
- Measure
- payment
- Baseline year
- 2019
- Final year
- 2024
- Baseline value
- 3112530.0
- Final value
- 24679492.0
- Increase
- 21566962.0
- Growth (%)
- 692.9078
- Domain
- besthhp.com
- Sales evidence
- Patient contact form and direct telephone accompany nursing, therapy and aide service pages.
- Operations evidence
- Current site and payer use 26236 Industrial Boulevard; the older NPI address is 26230. Clinical recruitment links to Workable.
- External evidence
- HPSM lists the exact NPI and California license; HCAI lists the Hayward agency as open. | CMS 2025 patient survey: 333 responses, 17% response rate.
- Events evidence
- No dated in-person event verified in the documented searches.
- Audience evidence
- 58 Google reviews on the freshly retrieved branch profile, with both care and therapy accounts. Website/Google traffic unavailable.
- Overlap
- False
- Overlap type
- —
- Evidence sources
- https://npiregistry.cms.hhs.gov/api/?number=1144592916&version=2.1
- https://besthhp.com/contact/
- https://besthhp.com/careers/
- https://besthhp.com/
- https://www.hpsm.org/docs/default-source/member-manuals/hpsm_directory_ca-dsnp-2026_202511031017.pdf?sfvrsn=b40907da_19
- https://reviews.birdeye.com/best-home-health-providers-inc-168199803864437
- https://hcai.ca.gov/facility/best-home-health-providers-inc/
- https://data.cms.gov/provider-data/sites/default/files/resources/706e7ad48548f6f3893109f403dd9fd8_1782764088/HHCAHPS_Provider_Jul2026.csv
Hoag Home Health payment 15,748,345 2,285.6% - Rank
- 3
- Provider or office
- Hoag Home Health
- Legal identity
- HOAG HOME HEALTH LLC
- Provider ID (CCN)
- 557412
- NPI
- 1174192892
- City
- Newport Beach
- Measure
- payment
- Baseline year
- 2019
- Final year
- 2024
- Baseline value
- 689020.0
- Final value
- 16437365.0
- Increase
- 15748345.0
- Growth (%)
- 2285.6151
- Domain
- hoag.org
- Sales evidence
- Home-health inquiry form and direct line; program lists Orange County coverage and Medicare, Medi-Cal, HMO and PPO insurance.
- Operations evidence
- Hoag Home Health LLC is the current operator; this CCN carried the Companion Home Health name in the earlier billing years. Post-acute and clinical leaders are named.
- External evidence
- UnitedHealthcare matches the exact NPI and Newport Beach office; Vivante describes its broader Hoag care partnership. | CMS 2025 patient survey: 333 responses, 19% response rate.
- Events evidence
- OASIS Senior Center advertised a January 22, 2025 fall-prevention screening, Room 4, 801 Narcissus Avenue. Attendance remains unverified.
- Audience evidence
- July 2026: 503,050 estimated visits; Google supplied 31.14% of desktop traffic; 12,100 US searches for “hoag.” Entire hospital network.
- Overlap
- False
- Overlap type
- —
- Evidence sources
- https://npiregistry.cms.hhs.gov/api/?number=1174192892&version=2.1
- https://www.hoag.org/programs/hoag-at-home/
- https://www.cms.gov/files/document/pac-hha-cy2026-compliant-apu-20260316.pdf
- https://www.prnewswire.com/news-releases/hoag-at-home-launches-home-health-hospice-and-home-visiting-physician-services-to-orange-county-301314219.html
- https://friendsofoasis.org/images/website/1332/files/OASIS_News_2025.pdf
- https://www.hoagorthopedicinstitute.com/patient-stories/back-on-the-trails-after-knee-replacement/
- https://uhc-gpd-green.uhc.com/content/dam/uhcdotcom/en/Legal/required-state-notices/ca-pd/EICA00PO0271355.pdf
- https://vivanteliving.com/assisted-living-newport-center/
- https://data.cms.gov/provider-data/sites/default/files/resources/706e7ad48548f6f3893109f403dd9fd8_1782764088/HHCAHPS_Provider_Jul2026.csv
- https://www.semrush.com/website/hoag.org/overview/
NATHAN O OGBATUE / California Home Health Agency Medicaid company codes 12,626,434.2 1,947.7% - Rank
- 4
- Provider or office
- NATHAN O OGBATUE / California Home Health Agency
- Legal identity
- NATHAN O OGBATUE (Type 2 organization), DBA CALIFORNIA HOME HEALTH AGENCY
- Provider ID (CCN)
- medicaid-1922477975
- NPI
- 1922477975
- City
- RIVERSIDE
- Measure
- Medicaid company codes
- Baseline year
- 2019
- Final year
- 2024
- Baseline value
- 648270.80
- Final value
- 13274705.00
- Increase
- 12626434.20
- Growth (%)
- 1947.7098
- Domain
- californiahha.com
- Sales evidence
- California Home Health advertises nursing, aides and therapy and has a working appointment form requesting contact details and a preferred time.
- Operations evidence
- The federal organization name is NATHAN O OGBATUE, DBA California Home Health Agency. The Riverside address and named manager match the company and BBB records.
- External evidence
- IEHP’s November 2024 HMO directory lists the exact NPI and license; HCAI records the agency as open.
- Events evidence
- No dated in-person event verified in the documented searches.
- Audience evidence
- Website visits and Google search metrics unavailable; no matched numeric public audience observation retained.
- Overlap
- False
- Overlap type
- —
- Baseline source
- Evidence sources
- https://npiregistry.cms.hhs.gov/api/?number=1922477975&version=2.1
- http://www.californiahha.com/
- https://www.iehp.org/content/dam/iehp-org/en/documents/coveredcalifornia/provider-directory/2024/november-2024/Covered%20Californa_Provider%20Directory_November_2024_508.pdf
- https://hcai.ca.gov/facility/california-home-health-agency/
- https://www.bbb.org/us/ca/riverside/profile/home-health-care/california-home-health-agency-1126-850059360
- http://www.californiahha.com/home-health-care-set-an-appointment
- http://www.californiahha.com/home-health-care-career-opportunities
Archer Health Inc payment 11,405,516 2,323.9% - Rank
- 5
- Provider or office
- Archer Health Inc
- Legal identity
- OPTIMAL HEALTH CARE INC, DBA ARCHER HEALTH, INC.
- Provider ID (CCN)
- 053124
- NPI
- 1053741017
- City
- Carlsbad
- Measure
- payment
- Baseline year
- 2019
- Final year
- 2024
- Baseline value
- 490801.0
- Final value
- 11896317.0
- Increase
- 11405516.0
- Growth (%)
- 2323.8575
- Domain
- archerhealthinc.com
- Sales evidence
- Archer’s form separates patient/family, provider and insurer inquiries; service pages market nursing, therapy, aides and social work.
- Operations evidence
- The company is registered as Optimal Health Care Inc., DBA Archer Health, at the Carlsbad office. Its website links AppOne recruitment and publishes patient accounts.
- External evidence
- Sharp’s July 2026 Choice Network directory lists the exact NPI and home visits; HCAI records the Carlsbad agency as open. | CMS 2025 patient survey: 172 responses, 19% response rate.
- Events evidence
- No dated in-person event verified in the documented searches.
- Audience evidence
- Website visits and Google search metrics unavailable; no matched numeric public audience observation retained.
- Overlap
- False
- Overlap type
- —
- Evidence sources
- https://npiregistry.cms.hhs.gov/api/?number=1053741017&version=2.1
- https://archerhealthinc.com/
- https://www.sharphealthplan.com/docs/default-source/provider-directories/2026/choice_provider_directory.pdf
- https://archerhealthinc.com/careers/
- https://archerhealthinc.com/partnership-announcement/
- https://hcai.ca.gov/facility/archer-health-inc/
- https://data.cms.gov/provider-data/sites/default/files/resources/706e7ad48548f6f3893109f403dd9fd8_1782764088/HHCAHPS_Provider_Jul2026.csv
Homebridge Inc., San Francisco SF city paid vouchers 9,962,814.2 38% - Rank
- 6
- Provider or office
- Homebridge Inc., San Francisco
- Legal identity
- HOMEBRIDGE INC
- Provider ID (CCN)
- local-homebridge
- NPI
- 1790954691
- City
- San Francisco
- Measure
- SF city paid vouchers
- Baseline year
- FY2019
- Final year
- FY2026
- Baseline value
- 26243250.24
- Final value
- 36206064.44
- Increase
- 9962814.2
- Growth (%)
- 37.96333955926947
- Domain
- homebridgeca.org
- Sales evidence
- The IHSS Public Authority gives ECM eligibility and enrollment contacts. Homebridge describes IHSS contract care and supportive-housing services.
- Operations evidence
- Market Street office matches the registry. The company recruits home-care workers and publishes a dated hospital-discharge client story.
- External evidence
- City analysts report 42,964 care hours per month in FY2023–24, rising to 45,719 through December 2024. The August 2024 site review found grant compliance; five of nine performance targets were missed.
- Events evidence
- June 2024 city minutes describe a workforce gathering at Homebridge hosted by its CEO. The exact gathering date is unpublished.
- Audience evidence
- Website visits and Google search metrics unavailable; no matched numeric public audience observation retained.
- Overlap
- True
- Overlap type
- Futuro training partner
- Evidence sources
- https://npiregistry.cms.hhs.gov/api/?number=1790954691&version=2.1
- https://www.sfihsspa.org/newsletters/uploads/pdf/spring-2026-newsletter-en-260420085937.pdf
- https://homebridgeca.org/programs/
- https://homebridgeca.org/careers/
- https://homebridgeca.org/2026/04/from-hospital-to-home/
- https://www.sfhsa.org/services/disability-aging/home-care/home-supportive-services-ihss/ihss-system
- https://www.seiu2015.org/may-2025-member-newsletter/
- https://media.api.sf.gov/documents/2024.06.05_WISF_Meeting_Minutes.pdf
- https://sfgov.legistar.com/View.ashx?GUID=FEF7ED3E-E606-4C9C-A8FE-01FA5D1BBD62&ID=14117973&M=F
BLC Homehealth Inc payment 9,319,911 8,388.2% - Rank
- 7
- Provider or office
- BLC Homehealth Inc
- Legal identity
- BLC HOMEHEALTH INC.
- Provider ID (CCN)
- 053137
- NPI
- 1295365658
- City
- San Leandro
- Measure
- payment
- Baseline year
- 2019
- Final year
- 2024
- Baseline value
- 111107.0
- Final value
- 9431018.0
- Increase
- 9319911.0
- Growth (%)
- 8388.2303
- Domain
- blchomehealth.com
- Sales evidence
- Nursing, therapy, aides and social work are offered across twelve counties, with a public patient inquiry form.
- Operations evidence
- Weekday office hours and on-call coverage are published. The contact body retains Merced Street; its footer and NPI use Wicks Boulevard. Recruiting describes clinical and intake roles.
- External evidence
- CMS lists the exact CCN as compliant with 2026 quality reporting. A BBB customer account describes nursing and therapy visits while criticizing scheduling. | CMS 2025 patient survey: 275 responses, 16% response rate.
- Events evidence
- No dated in-person event verified in the documented searches.
- Audience evidence
- Website visits and Google search metrics unavailable; no matched numeric public audience observation retained.
- Overlap
- False
- Overlap type
- —
- Evidence sources
- https://npiregistry.cms.hhs.gov/api/?number=1295365658&version=2.1
- https://www.blchomehealth.com/
- https://www.blchomehealth.com/home-health-care-contact-us
- https://www.blchomehealth.com/home-health-care-careers
- https://www.blchomehealth.com/home-health-care-meet-our-team
- https://www.cms.gov/files/document/pac-hha-cy2026-compliant-apu-20260316.pdf
- https://www.bbb.org/us/ca/san-leandro/profile/health-care/blc-homehealth-inc-1116-960397
- https://data.cms.gov/provider-data/sites/default/files/resources/706e7ad48548f6f3893109f403dd9fd8_1782764088/HHCAHPS_Provider_Jul2026.csv
Central Coast Home Health Inc., San Luis Obispo payment 8,901,119 41.8% - Rank
- 8
- Provider or office
- Central Coast Home Health Inc., San Luis Obispo
- Legal identity
- CENTRAL COAST HOME HEALTH INC
- Provider ID (CCN)
- 059010
- NPI
- 1609044924
- City
- San Luis Obispo
- Measure
- payment
- Baseline year
- 2019
- Final year
- 2024
- Baseline value
- 21275435.0
- Final value
- 30176554.0
- Increase
- 8901119.0
- Growth (%)
- 41.8375
- Domain
- centralcoasthomehealth.com
- Sales evidence
- A physician referral form requests clinical records, selected services and signature; it gives a dedicated home-health fax.
- Operations evidence
- SLO and Santa Barbara offices are published. The linked employer portal displayed 17 job cards and a company-wide claim of more than 300 employees.
- External evidence
- HCAI lists the agency as open. A January 2025 local obituary thanks its care team for home care during 2024; the account covers the combined home-health/hospice brand. | CMS 2025 patient survey: 351 responses, 24% response rate.
- Events evidence
- Presenting sponsor of the September 2025 Templeton tennis tournament; listed employer at the August 21, 2025 Fresno Convention Center hiring summit.
- Audience evidence
- LinkedIn snapshot: 670 followers and 209 associated profiles, company-wide. Website/Google traffic unavailable.
- Overlap
- False
- Overlap type
- —
- Evidence sources
- https://npiregistry.cms.hhs.gov/api/?number=1609044924&version=2.1
- https://centralcoasthomehealth.com/
- https://centralcoasthomehealth.com/wp-content/uploads/2020/08/Home%20Health%20Referral%20Low%20Vision%20Program%20revised2.pdf
- https://mycchh.hiringthing.com/
- https://hcai.ca.gov/facility/central-coast-home-health-inc/
- https://tennistourtalk.com/126244/olivia-gadecki-and-kayla-day-advance-to-final-four-at-central-coast-tennis-classic
- https://events.bizzabo.com/hireucfresno/home
- https://www.linkedin.com/company/central-coast-home-health-inc-
- https://esterobaynews.com/wp-content/uploads/2025/01/EBN-1-16-25.pdf
- https://data.cms.gov/provider-data/sites/default/files/resources/706e7ad48548f6f3893109f403dd9fd8_1782764088/HHCAHPS_Provider_Jul2026.csv
Lorian Health, San Diego payment 8,120,122 144.7% - Rank
- 9
- Provider or office
- Lorian Health, San Diego
- Legal identity
- LORIAN HOME SYSTEMS, INC.
- Provider ID (CCN)
- 058113
- NPI
- 1447318092
- City
- San Diego
- Measure
- payment
- Baseline year
- 2019
- Final year
- 2024
- Baseline value
- 5610689.0
- Final value
- 13730811.0
- Increase
- 8120122.0
- Growth (%)
- 144.7259
- Domain
- lorianhealth.com
- Sales evidence
- Public inquiry form and a dedicated San Diego home-health intake line; nursing, therapy and wound care pages.
- Operations evidence
- Company and payer use Granite Ridge Drive; NPI retains Sky Park Court. An SDSU-hosted clinician CV describes in-home assessments for Lorian from August 2025.
- External evidence
- UnitedHealthcare matches the NPI and current office. San Diego Health Connect lists Lorian in its July 2026 participant matrix. | CMS 2025 patient survey: 404 responses, 23% response rate.
- Events evidence
- A company LinkedIn recap shows a San Diego skills fair; only a relative posting age was visible, the exact event date remains unverified.
- Audience evidence
- LinkedIn snapshot: 2,413 followers and 211 associated profiles, group-wide. Website/Google traffic unavailable.
- Overlap
- False
- Overlap type
- —
- Evidence sources
- https://npiregistry.cms.hhs.gov/api/?number=1447318092&version=2.1
- https://www.lorianhealth.com/contact
- https://www.lorianhealth.com/
- https://www.linkedin.com/company/lorianhealth
- https://uhc-gpd-green.uhc.com/content/dam/uhcdotcom/en/Legal/required-state-notices/ca-pd/EICA00PP0271416.pdf
- https://sdhealthconnect.org/participants/
- https://www.caring.com/senior-care/california/san-diego/lorian-health-home-health-care
- https://www.visionxmedia.io/work
- https://socialwork.sdsu.edu/_resources/files/cv/2025-hileman-wendy-cv.pdf
- https://data.cms.gov/provider-data/sites/default/files/resources/706e7ad48548f6f3893109f403dd9fd8_1782764088/HHCAHPS_Provider_Jul2026.csv
Sutter Care at Home, Modesto / Salida payment 7,948,666 130.3% - Rank
- 10
- Provider or office
- Sutter Care at Home, Modesto / Salida
- Legal identity
- SUTTER VISITING NURSE ASSOCIATION AND HOSPICE
- Provider ID (CCN)
- 057695
- NPI
- 1972876506
- City
- Modesto
- Measure
- payment
- Baseline year
- 2019
- Final year
- 2024
- Baseline value
- 6102600.0
- Final value
- 14051266.0
- Increase
- 7948666.0
- Growth (%)
- 130.2505
- Domain
- sutterhealth.org
- Sales evidence
- Sutter publishes Modesto-branch admissions at 209-342-4091, with nursing, therapy, aide and social-work services.
- Operations evidence
- Current “Modesto” office is in Salida, matching the updated NPI. An employer posting recruits a South Valley clinical manager in Salida.
- External evidence
- IHI identifies the Modesto-Salida home-health site in its Age-Friendly recognition program. | CMS 2025 patient survey: 1,211 responses, 23% response rate.
- Events evidence
- No dated in-person event verified in the documented searches.
- Audience evidence
- Website visits and Google search metrics unavailable; no matched numeric public audience observation retained.
- Overlap
- False
- Overlap type
- —
- Evidence sources
- https://npiregistry.cms.hhs.gov/api/?number=1972876506&version=2.1
- https://www.sutterhealth.org/services/home-health-hospice-locations
- https://www.sutterhealth.org/services/home-health
- https://www.linkedin.com/jobs/view/clinical-manager-pt-or-rn-home-health-at-sutter-health-4439926581
- https://www.ihi.org/partner/initiatives/age-friendly-health-systems/recognized-health-care-sites
- https://data.cms.gov/provider-data/sites/default/files/resources/706e7ad48548f6f3893109f403dd9fd8_1782764088/HHCAHPS_Provider_Jul2026.csv
ASAP HOME HEALTH, INC Medicaid selected care codes 7,826,624.4 132.9% - Rank
- 11
- Provider or office
- ASAP HOME HEALTH, INC
- Legal identity
- ASAP HOME HEALTH, INC
- Provider ID (CCN)
- medicaid-1003969114
- NPI
- 1003969114
- City
- PALMDALE
- Measure
- Medicaid selected care codes
- Baseline year
- 2019
- Final year
- 2020
- Baseline value
- 5889262.24
- Final value
- 13715886.62
- Increase
- 7826624.38
- Growth (%)
- 132.8965
- Domain
- asaphomehealth.com
- Sales evidence
- The matched website is an “Under Construction” holding page. ACCESS TLC supplies a phone/email referral contact and lists RN/LVN and aide shift care.
- Operations evidence
- CAHSAH lists the Palmdale office, administrator Roy Williams and other staff; DDS names an organizational representative.
- External evidence
- ACCESS TLC lists the company as an HCBA service provider. HCAI records the Palmdale agency as open. | CMS 2025 patient-survey results unavailable (footnote 12).
- Events evidence
- No dated in-person event verified in the documented searches.
- Audience evidence
- Website visits and Google search metrics unavailable; no matched numeric public audience observation retained.
- Overlap
- False
- Overlap type
- —
- Baseline source
- Evidence sources
- https://npiregistry.cms.hhs.gov/api/?number=1003969114&version=2.1
- https://asaphomehealth.com
- https://www.cahsah.org/member-directory/asap-home-health-inc
- https://accesstlc.com/wp-content/uploads/2025/03/HCBA-Waiver-Service-Providers-ACCESS-TLC-QUALIFIED-PROVIDER-LIST-03.07.2025.pdf
- https://www.dds.ca.gov/wp-content/uploads/2025/04/ICC_MeetingPacket_2025-Feb.pdf
- https://hcai.ca.gov/facility/asap-home-health-service/
- https://data.cms.gov/provider-data/sites/default/files/resources/706e7ad48548f6f3893109f403dd9fd8_1782764088/HHCAHPS_Provider_Jul2026.csv
Bridge Home Health, East Bay / Walnut Creek payment 7,512,351 1,353.6% - Rank
- 12
- Provider or office
- Bridge Home Health, East Bay / Walnut Creek
- Legal identity
- BRIDGE HOME HEALTH EAST BAY LLC
- Provider ID (CCN)
- 559097
- NPI
- 1538659768
- City
- Walnut Creek
- Measure
- payment
- Baseline year
- 2020
- Final year
- 2021
- Baseline value
- 554990.0
- Final value
- 8067341.0
- Increase
- 7512351.0
- Growth (%)
- 1353.6011
- Domain
- bridgehh.com
- Sales evidence
- East Bay service page lists a Walnut Creek office, phone and fax; the group provides a patient inquiry form.
- Operations evidence
- Current NPI uses Petaluma; website and September 2026 payer directory use Walnut Creek. The reason for the difference remains unresolved.
- External evidence
- Partnership HealthPlan’s September 10, 2026 directory lists the exact East Bay NPI and Walnut Creek office. | CMS 2025 patient survey: 68 responses, 23% response rate. CMS flags fewer than 70 responses.
- Events evidence
- Right at Home documents a professional meeting with Bridge’s director of nursing; the page supplies no date.
- Audience evidence
- Website visits and Google search metrics unavailable; no matched numeric public audience observation retained.
- Overlap
- False
- Overlap type
- —
- Evidence sources
- https://npiregistry.cms.hhs.gov/api/?number=1538659768&version=2.1
- https://www.bridgehh.com/walnut-creek-home-health/
- https://www.bridgehh.com/contact-us/
- https://partnershiphp.org/Providers/Medi-Cal/Documents/Provider%20Directory/MCSonomaProDir.pdf
- https://www.rightathome.net/pleasanton/about-us/areas-served/pleasanton
- https://www.indeed.com/cmp/Bridge-Home-Health-and-Hospice/locations/CA/Walnut%20Creek
- https://www.bridgehh.com/latest-news/
- https://data.cms.gov/provider-data/sites/default/files/resources/706e7ad48548f6f3893109f403dd9fd8_1782764088/HHCAHPS_Provider_Jul2026.csv
MAXIM HEALTHCARE SERVICES, INC. Medicaid company codes 7,455,139.2 1,105% - Rank
- 13
- Provider or office
- MAXIM HEALTHCARE SERVICES, INC.
- Legal identity
- MAXIM HEALTHCARE SERVICES, INC.
- Provider ID (CCN)
- medicaid-1972559565
- NPI
- 1972559565
- City
- FRESNO
- Measure
- Medicaid company codes
- Baseline year
- 2019
- Final year
- 2024
- Baseline value
- 674654.68
- Final value
- 8129793.84
- Increase
- 7455139.16
- Growth (%)
- 1105.0304
- Domain
- maximhealthcare.com
- Sales evidence
- Fresno branch inquiry form and a dedicated Central Valley Regional Center referral link accompany private-duty nursing services.
- Operations evidence
- The NPI and branch page match 6051 N. Fresno Street, Suite 102. Published patient excerpts describe care; FMS staffing is a separate service program.
- External evidence
- UnitedHealthcare’s ancillary-provider directory matches the Fresno home-health office and telephone. | CMS 2025 patient-survey results unavailable (footnote 12).
- Events evidence
- No dated in-person event verified in the documented searches.
- Audience evidence
- 84 branch-profile reviews: 72 Google and 12 Facebook, including worker and customer posts. Website/Google traffic unavailable.
- Overlap
- False
- Overlap type
- —
- Baseline source
- Evidence sources
- https://npiregistry.cms.hhs.gov/api/?number=1972559565&version=2.1
- https://www.maximhealthcare.com/maxim-healthcare-locations/fresno-ca-regional-office/
- https://www.maximfms.com/maxim-fms-california/
- https://ams-gateway.uhcprovider.com/content/dam/provider/docs/public/find-a-provider/CA-Signature-Value-HMO-ACP-QRG.pdf
- https://reviews.birdeye.com/maxim-healthcare-services-fresno-homecare-155750620123386
- https://data.cms.gov/provider-data/sites/default/files/resources/706e7ad48548f6f3893109f403dd9fd8_1782764088/HHCAHPS_Provider_Jul2026.csv
AMERICAN CAREQUEST, INC Medicaid company codes 7,308,602.3 3,215.4% - Rank
- 14
- Provider or office
- AMERICAN CAREQUEST, INC
- Legal identity
- AMERICAN CAREQUEST, INC
- Provider ID (CCN)
- medicaid-1417058397
- NPI
- 1417058397
- City
- BURLINGAME
- Measure
- Medicaid company codes
- Baseline year
- 2019
- Final year
- 2024
- Baseline value
- 227300.20
- Final value
- 7535902.54
- Increase
- 7308602.34
- Growth (%)
- 3215.3964
- Domain
- americancarequest.com
- Sales evidence
- Nursing, therapy and aide pages provide telephone access and a dedicated referral page.
- Operations evidence
- Burlingame recruiting includes an intake specialist coordinating referrals, authorizations and scheduling, plus aide and clinical roles.
- External evidence
- UnitedHealthcare lists American CareQuest at the same Cowan Road office and telephone. | CMS 2025 patient survey: 76 responses, 18% response rate.
- Events evidence
- No dated in-person event verified in the documented searches.
- Audience evidence
- Website visits and Google search metrics unavailable; no matched numeric public audience observation retained.
- Overlap
- False
- Overlap type
- —
- Baseline source
- Evidence sources
- https://npiregistry.cms.hhs.gov/api/?number=1417058397&version=2.1
- https://www.americancarequest.com/home-health-care-about-us
- https://www.americancarequest.com/home-health-care-send-your-referrals
- https://www.americancarequest.com/home-health-care-careers/job-posting
- https://www.americancarequest.com/home-health-care-meet-our-team
- https://ams-gateway.uhcprovider.com/content/dam/provider/docs/public/find-a-provider/CA-Signature-Value-HMO-ACP-QRG.pdf
- https://data.cms.gov/provider-data/sites/default/files/resources/706e7ad48548f6f3893109f403dd9fd8_1782764088/HHCAHPS_Provider_Jul2026.csv
Ace Home Health Care & Hospice, Inc payment 7,189,106 269.4% - Rank
- 15
- Provider or office
- Ace Home Health Care & Hospice, Inc
- Legal identity
- ACE HOME HEALTH CARE & HOSPICE INC
- Provider ID (CCN)
- 059461
- NPI
- 1437442878
- City
- Orinda
- Measure
- payment
- Baseline year
- 2019
- Final year
- 2024
- Baseline value
- 2668960.0
- Final value
- 9858066.0
- Increase
- 7189106.0
- Growth (%)
- 269.3598
- Domain
- acehomehealthandhospice.com
- Sales evidence
- Orinda appointment and referral pages provide direct contact and describe home-health, hospice and transitional-care services.
- Operations evidence
- Registry, current website and Kaiser match the Moraga Way office. Careers describe shifts and link an ADP recruitment portal.
- External evidence
- Kaiser’s facility directory identifies the exact NPI and Orinda office. | CMS 2025 patient survey: 489 responses, 22% response rate.
- Events evidence
- CEO listed as July 12, 2026 faculty at the Boston in-person summit. A March 18, 2020 Orinda grief group was advertised; actual attendance/occurrence unverified.
- Audience evidence
- One Caring.com review from October 2015 concerns the same office’s hospice program. Website/Google traffic unavailable.
- Overlap
- False
- Overlap type
- —
- Evidence sources
- https://npiregistry.cms.hhs.gov/api/?number=1437442878&version=2.1
- https://www.acehomehealthandhospice.com/
- https://www.acehomehealthandhospice.com/home-health-and-hospice-services-send-your-referrals
- https://www.acehomehealthandhospice.com/home-health-and-hospice-services-careers
- https://healthy.kaiserpermanente.org/northern-california/facilities/ace-home-health-hospice-461293
- https://s6.goeshow.com/alliance/financial/2026/pre_conference_events.cfm
- https://s6.goeshow.com/alliance/financial/2026/frequently_asked_questions.cfm
- https://myemail.constantcontact.com/Allen-Temple-Baptist-Church-E-Newsletter-for-the-week-of-March-1--2020.html?aid=DaoRFXhkSwM&soid=1104566295289
- https://data.cms.gov/provider-data/sites/default/files/resources/706e7ad48548f6f3893109f403dd9fd8_1782764088/HHCAHPS_Provider_Jul2026.csv
- https://www.caring.com/senior-care/california/orinda/ace-home-health-care-hospice
Sutter Care at Home, San Mateo payment 6,955,641 59.2% - Rank
- 16
- Provider or office
- Sutter Care at Home, San Mateo
- Legal identity
- SUTTER VISITING NURSE ASSOCIATION AND HOSPICE
- Provider ID (CCN)
- 058123
- NPI
- 1821027624
- City
- San Mateo
- Measure
- payment
- Baseline year
- 2019
- Final year
- 2024
- Baseline value
- 11743744.0
- Final value
- 18699385.0
- Increase
- 6955641.0
- Growth (%)
- 59.2285
- Domain
- sutterhealth.org
- Sales evidence
- San Mateo admissions: 650-685-2828; branch-specific phone and fax accompany Sutter’s home-health service page.
- Operations evidence
- The NPI and service directory match Suite 300A. An August 13, 2026 care-coordinator posting remains visible but is now inactive; hospice uses Suite 300B.
- External evidence
- Partnership HealthPlan lists the exact NPI and office; IHI identifies the San Mateo home-health site. | CMS 2025 patient survey: 768 responses, 27% response rate.
- Events evidence
- No dated in-person event verified in the documented searches.
- Audience evidence
- A consumer listing shows 11 comments at the older address and may include hospice accounts. Website/Google traffic unavailable.
- Overlap
- False
- Overlap type
- —
- Evidence sources
- https://npiregistry.cms.hhs.gov/api/?number=1821027624&version=2.1
- https://www.sutterhealth.org/services/home-health-hospice-locations
- https://www.sutterhealth.org/services/home-health
- https://jobs.sutterhealth.org/us/en/job/R-137929
- https://partnershiphp.org/Providers/Medi-Cal/Documents/Provider%20Directory/MCSonomaProDir.pdf
- https://www.ihi.org/partner/initiatives/age-friendly-health-systems/recognized-health-care-sites
- https://www.loc8nearme.com/california/san-mateo/sutter-care-at-home-san-mateo/5295776/
- https://data.cms.gov/provider-data/sites/default/files/resources/706e7ad48548f6f3893109f403dd9fd8_1782764088/HHCAHPS_Provider_Jul2026.csv
MAXIM HEALTHCARE SERVICES, INC. Medicaid company codes 6,853,465.9 315% - Rank
- 17
- Provider or office
- MAXIM HEALTHCARE SERVICES, INC.
- Legal identity
- MAXIM HEALTHCARE SERVICES, INC.
- Provider ID (CCN)
- medicaid-1831207109
- NPI
- 1831207109
- City
- ORANGE
- Measure
- Medicaid company codes
- Baseline year
- 2019
- Final year
- 2024
- Baseline value
- 2175778.88
- Final value
- 9029244.74
- Increase
- 6853465.86
- Growth (%)
- 314.9891
- Domain
- maximhealthcare.com
- Sales evidence
- Orange branch inquiry form and a Regional Center of Orange County referral link accompany private-duty nursing services.
- Operations evidence
- The NPI and branch page match 500 S. Main Street, Suite 600. Published customer excerpts describe care; the named FMS manager serves a separate program.
- External evidence
- UnitedHealthcare matches the office; an RCOC vendor list identifies Maxim’s Orange home-health service.
- Events evidence
- No dated in-person event verified in the documented searches.
- Audience evidence
- 103 Google reviews on the freshly retrieved matching branch profile, including critical and favorable accounts. Website/Google traffic unavailable.
- Overlap
- False
- Overlap type
- —
- Baseline source
- Evidence sources
- https://npiregistry.cms.hhs.gov/api/?number=1831207109&version=2.1
- https://www.maximhealthcare.com/maxim-healthcare-locations/orange-county-ca-regional-office/
- https://www.maximfms.com/maxim-fms-california/
- https://ams-gateway.uhcprovider.com/content/dam/provider/docs/public/find-a-provider/CA-Signature-Value-HMO-ACP-QRG.pdf
- https://iatp.iusd.org/sites/iatp/files/documents/Vendor_List_0.pdf
- https://reviews.birdeye.com/maxim-healthcare-orange-county-ca-regional-office-155750675206827
Amedisys Home Health Care charges 6,533,311 120.6% - Rank
- 18
- Provider or office
- Amedisys Home Health Care
- Legal identity
- TENDER LOVING CARE HEALTH CARE SERVICES WESTERN, LLC
- Provider ID (CCN)
- 557194
- NPI
- 1114971280
- City
- Hayward
- Measure
- charges
- Baseline year
- 2019
- Final year
- 2024
- Baseline value
- 5415753.0
- Final value
- 11949064.0
- Increase
- 6533311.0
- Growth (%)
- 120.6353
- Domain
- amedisys.com
- Sales evidence
- Hayward center 3502 provides a direct line, inquiry route and eligibility quiz for nursing, aides and therapy.
- Operations evidence
- Tender Loving Care Health Care Services Western LLC is the legal operator. The county independently records this exact office as a medical-waste generator.
- External evidence
- UnitedHealthcare matches the Hayward office and phone; HCAI records the parent agency as open. | CMS 2025 patient survey: 133 responses, 18% response rate.
- Events evidence
- No dated in-person event verified in the documented searches.
- Audience evidence
- Website visits and Google search metrics unavailable; no matched numeric public audience observation retained.
- Overlap
- False
- Overlap type
- —
- Evidence sources
- https://npiregistry.cms.hhs.gov/api/?number=1114971280&version=2.1
- https://locations.amedisys.com/ca/hayward/home-health-3502/
- https://ams-gateway.uhcprovider.com/content/dam/provider/docs/public/find-a-provider/CA-Signature-Value-HMO-ACP-QRG.pdf
- https://hcai.ca.gov/facility/amedisys-home-health-care-hayward-parent/
- https://deh.acgov.org/solidwaste-assets/docs/medwaste/MedicalWasteGeneratorList.pdf
- https://data.cms.gov/provider-data/sites/default/files/resources/706e7ad48548f6f3893109f403dd9fd8_1782764088/HHCAHPS_Provider_Jul2026.csv
COASTAL KIDS HOME CARE Medicaid company codes 6,455,392.4 1,694% - Rank
- 19
- Provider or office
- COASTAL KIDS HOME CARE
- Legal identity
- COASTAL KIDS HOME CARE
- Provider ID (CCN)
- medicaid-1598828436
- NPI
- 1598828436
- City
- SALINAS
- Measure
- Medicaid company codes
- Baseline year
- 2019
- Final year
- 2024
- Baseline value
- 381072.47
- Final value
- 6836464.86
- Increase
- 6455392.39
- Growth (%)
- 1694.0065
- Domain
- coastalkidshomecare.org
- Sales evidence
- Published physician-referral fax, office contact and 24/7 nursing line support pediatric home-care intake.
- Operations evidence
- Named nursing and rehabilitation leaders are published. Website and 2026 payer directory use Pajaro Street; NPI retains the earlier Merrill Street address.
- External evidence
- Hartnell lists a clinical partnership. Aesthetx describes a $10,000 donation and a visit with a family receiving the company’s nursing care.
- Events evidence
- Independent event listing advertised the September 13, 2026 Touch-A-Truck at Salinas Rodeo Grounds. Post-event attendance was not retrieved.
- Audience evidence
- LinkedIn snapshot: 400 followers and 74 associated profiles, company-wide. Website/Google traffic unavailable.
- Overlap
- False
- Overlap type
- —
- Baseline source
- Evidence sources
- https://npiregistry.cms.hhs.gov/api/?number=1598828436&version=2.1
- https://www.coastalkidshomecare.org/events
- https://www.coastalkidshomecare.org/who-we-are
- https://www.coastalkidshomecare.org/meetourkids/meet-emma.
- https://specialkidsconnect.org/event/coastal-kids-home-cares-touch-a-truck-event-salinas/984.html
- https://ams-gateway.uhcprovider.com/content/dam/provider/docs/public/find-a-provider/CA-Signature-Value-HMO-ACP-QRG.pdf
- https://www.hartnell.edu/academics/meta-majors/health-sciences/clinical-agencies-community-partnerships.html
- https://www.aesthetx.com/blog/aesthetx-gives-back/
- https://www.linkedin.com/company/coastal-kids-home-care
Elegance Healthcare, Inc payment 6,446,505 346.4% - Rank
- 20
- Provider or office
- Elegance Healthcare, Inc
- Legal identity
- ELEGANCE HEALTHCARE, INC.
- Provider ID (CCN)
- 553107
- NPI
- 1396117982
- City
- Encino
- Measure
- payment
- Baseline year
- 2019
- Final year
- 2024
- Baseline value
- 1861012.0
- Final value
- 8307517.0
- Increase
- 6446505.0
- Growth (%)
- 346.3978
- Domain
- elegancehealthcare.com
- Sales evidence
- Southern California consultation form requests a physician-order acknowledgment; an aide page offers personal-care services.
- Operations evidence
- The Encino address and telephone match the NPI; the agency describes multilingual field staff. The registry names its CEO.
- External evidence
- HCAI identifies the exact Encino agency as an open parent facility; hospital relationships are presently supported by its own list. | CMS 2025 patient survey: 119 responses, 14% response rate.
- Events evidence
- No dated in-person event verified in the documented searches.
- Audience evidence
- Website visits and Google search metrics unavailable; no matched numeric public audience observation retained.
- Overlap
- False
- Overlap type
- —
- Evidence sources
- https://npiregistry.cms.hhs.gov/api/?number=1396117982&version=2.1
- https://elegancehealthcare.com/about-us/
- https://elegancehealthcare.com/home-health-aides/
- https://hcai.ca.gov/facility/elegance-healthcare-inc/
- https://data.cms.gov/provider-data/sites/default/files/resources/706e7ad48548f6f3893109f403dd9fd8_1782764088/HHCAHPS_Provider_Jul2026.csv
Therapeutic and agency comparisons. Annual payment and patient records; comparison ranking. The series follows provider 059426 through nine CMS files, including 2016 and 2017. Payments rose from $316,201 to $3,352,094 in 2021–22 as patients rose from 65 to 807; payment per patient fell 14.6%. Agency comparison.
Agency comparisons Data Sea Coast Home Health Care Inc $60,318 $5,345,558 8,762.3% - Provider ID (CCN)
- 559055
- Provider
- Sea Coast Home Health Care Inc
- City
- San Diego
- 2019 Medicare payments
- 60318
- 2024 Medicare payments
- 5345558
- Payment increase
- 5285240
- Payment growth (%)
- 8762.293179482078
- 2019 Medicare patients
- 14.0
- 2024 Medicare patients
- 684.0
- Patient growth (%)
- 4785.714285714285
- 2019 payment per patient
- 4308.428571428572
- 2024 payment per patient
- 7815.143274853801
- Payment per patient growth (%)
- 81.39196566191387
- Certification date
- 07/03/2019
- Medicare spending per beneficiary, July 2026
- 1.06
- MSPB episodes
- 2196.0
- Quality stars, July 2026
- 4.0
- Completed surveys
- 91.0
- Survey response (%)
- 10.0
- Survey stars
- 2.0
- Survey recommendation (%)
- 62.0
- 2019 source row
- 1747
- 2024 source URL
- 2024 source row
- 1517
- Quality source row
- 1657
- Survey source row
- 8540
Blc Homehealth Inc $111,107 $9,431,018 8,388.2% - Provider ID (CCN)
- 053137
- Provider
- Blc Homehealth Inc
- City
- San Leandro
- 2019 Medicare payments
- 111107
- 2024 Medicare payments
- 9431018
- Payment increase
- 9319911
- Payment growth (%)
- 8388.230264519787
- 2019 Medicare patients
- 17.0
- 2024 Medicare patients
- 1289.0
- Patient growth (%)
- 7482.352941176471
- 2019 payment per patient
- 6535.705882352941
- 2024 payment per patient
- 7316.538401861909
- Payment per patient growth (%)
- 11.947179594132184
- Certification date
- 08/24/2017
- Medicare spending per beneficiary, July 2026
- 0.95
- MSPB episodes
- 2638.0
- Quality stars, July 2026
- 5.0
- Completed surveys
- 275.0
- Survey response (%)
- 16.0
- Survey stars
- 2.0
- Survey recommendation (%)
- 69.0
- 2019 source row
- 444
- 2024 source URL
- 2024 source row
- 422
- Quality source row
- 426
- Survey source row
- 426
Preferred Choice Home Health Care, Inc $156,219 $6,543,026 4,088.4% - Provider ID (CCN)
- 559037
- Provider
- Preferred Choice Home Health Care, Inc
- City
- Reseda
- 2019 Medicare payments
- 156219
- 2024 Medicare payments
- 6543026
- Payment increase
- 6386807
- Payment growth (%)
- 4088.3676121342473
- 2019 Medicare patients
- 30.0
- 2024 Medicare patients
- 948.0
- Patient growth (%)
- 3060.0
- 2019 payment per patient
- 5207.3
- 2024 payment per patient
- 6901.926160337553
- Payment per patient growth (%)
- 32.54327886500783
- Certification date
- 06/20/2019
- Medicare spending per beneficiary, July 2026
- 1.03
- MSPB episodes
- 2137.0
- Quality stars, July 2026
- 2.5
- Completed surveys
- 72.0
- Survey response (%)
- 8.0
- Survey stars
- 2.0
- Survey recommendation (%)
- 71.0
- 2019 source row
- 1743
- 2024 source URL
- 2024 source row
- 1504
- Quality source row
- 1640
- Survey source row
- 8523
Bay Nation Home Health Services Inc $114,967 $3,435,748 2,888.5% - Provider ID (CCN)
- 553127
- Provider
- Bay Nation Home Health Services Inc
- City
- Newark
- 2019 Medicare payments
- 114967
- 2024 Medicare payments
- 3435748
- Payment increase
- 3320781
- Payment growth (%)
- 2888.464515904564
- 2019 Medicare patients
- 26.0
- 2024 Medicare patients
- 450.0
- Patient growth (%)
- 1630.7692307692307
- 2019 payment per patient
- 4421.807692307692
- 2024 payment per patient
- 7634.995555555555
- Payment per patient growth (%)
- 72.66683869670814
- Certification date
- 01/15/2019
- Medicare spending per beneficiary, July 2026
- 0.89
- MSPB episodes
- 578.0
- Quality stars, July 2026
- 2.5
- Completed surveys
- 125.0
- Survey response (%)
- 13.0
- Survey stars
- 1.0
- Survey recommendation (%)
- 42.0
- 2019 source row
- 1568
- 2024 source URL
- 2024 source row
- 1318
- Quality source row
- 1435
- Survey source row
- 8318
Blessed Heart Home Care, Inc $101,393 $2,739,646 2,602% - Provider ID (CCN)
- 553126
- Provider
- Blessed Heart Home Care, Inc
- City
- Burbank
- 2019 Medicare payments
- 101393
- 2024 Medicare payments
- 2739646
- Payment increase
- 2638253
- Payment growth (%)
- 2602.007041906246
- 2019 Medicare patients
- 17.0
- 2024 Medicare patients
- 219.0
- Patient growth (%)
- 1188.235294117647
- 2019 payment per patient
- 5964.294117647059
- 2024 payment per patient
- 12509.79908675799
- Payment per patient growth (%)
- 109.7448388694346
- Certification date
- 09/07/2018
- Medicare spending per beneficiary, July 2026
- 0.98
- MSPB episodes
- 787.0
- Quality stars, July 2026
- 4.5
- Completed surveys
- 18.0
- Survey response (%)
- 7.0
- Survey stars
- —
- Survey recommendation (%)
- 87.0
- 2019 source row
- 1567
- 2024 source URL
- 2024 source row
- 1317
- Quality source row
- 1434
- Survey source row
- 8317
Archer Health Inc $490,801 $11,896,317 2,323.9% - Provider ID (CCN)
- 053124
- Provider
- Archer Health Inc
- City
- Carlsbad
- 2019 Medicare payments
- 490801
- 2024 Medicare payments
- 11896317
- Payment increase
- 11405516
- Payment growth (%)
- 2323.8575308526265
- 2019 Medicare patients
- 82.0
- 2024 Medicare patients
- 1971.0
- Patient growth (%)
- 2303.6585365853657
- 2019 payment per patient
- 5985.378048780488
- 2024 payment per patient
- 6035.675799086758
- Payment per patient growth (%)
- 0.8403437493228694
- Certification date
- 06/27/2017
- Medicare spending per beneficiary, July 2026
- 0.93
- MSPB episodes
- 3383.0
- Quality stars, July 2026
- 5.0
- Completed surveys
- 172.0
- Survey response (%)
- 19.0
- Survey stars
- 3.0
- Survey recommendation (%)
- 66.0
- 2019 source row
- 434
- 2024 source URL
- 2024 source row
- 413
- Quality source row
- 418
- Survey source row
- 418
Hoag Home Health $689,020 $16,437,365 2,285.6% - Provider ID (CCN)
- 557412
- Provider
- Hoag Home Health
- City
- Newport Beach
- 2019 Medicare payments
- 689020
- 2024 Medicare payments
- 16437365
- Payment increase
- 15748345
- Payment growth (%)
- 2285.615076485443
- 2019 Medicare patients
- 139.0
- 2024 Medicare patients
- 3789.0
- Patient growth (%)
- 2625.8992805755393
- 2019 payment per patient
- 4956.978417266187
- 2024 payment per patient
- 4338.180258643441
- Payment per patient growth (%)
- -12.483374074564102
- Certification date
- 07/27/1994
- Medicare spending per beneficiary, July 2026
- 0.94
- MSPB episodes
- 9480.0
- Quality stars, July 2026
- 5.0
- Completed surveys
- 333.0
- Survey response (%)
- 19.0
- Survey stars
- 3.0
- Survey recommendation (%)
- 78.0
- 2019 source row
- 1659
- 2024 source URL
- 2024 source row
- 1408
- Quality source row
- 1532
- Survey source row
- 8415
Healing Touch Home Health Care Inc $135,425 $3,205,296 2,266.8% - Provider ID (CCN)
- 553195
- Provider
- Healing Touch Home Health Care Inc
- City
- Rancho Cordova
- 2019 Medicare payments
- 135425
- 2024 Medicare payments
- 3205296
- Payment increase
- 3069871
- Payment growth (%)
- 2266.842163559166
- 2019 Medicare patients
- 29.0
- 2024 Medicare patients
- 444.0
- Patient growth (%)
- 1431.0344827586207
- 2019 payment per patient
- 4669.827586206897
- 2024 payment per patient
- 7219.135135135135
- Payment per patient growth (%)
- 54.59104221444999
- Certification date
- 05/01/2019
- Medicare spending per beneficiary, July 2026
- 0.86
- MSPB episodes
- 907.0
- Quality stars, July 2026
- 5.0
- Completed surveys
- 98.0
- Survey response (%)
- 23.0
- Survey stars
- 5.0
- Survey recommendation (%)
- 88.0
- 2019 source row
- 1617
- 2024 source URL
- 2024 source row
- 1365
- Quality source row
- 1488
- Survey source row
- 8371
Therapeutic Home Healthcare $218,529 $4,992,198 2,184.5% - Provider ID (CCN)
- 059426
- Provider
- Therapeutic Home Healthcare
- City
- Fresno
- 2019 Medicare payments
- 218529
- 2024 Medicare payments
- 4992198
- Payment increase
- 4773669
- Payment growth (%)
- 2184.4556100105706
- 2019 Medicare patients
- 74.0
- 2024 Medicare patients
- 982.0
- Patient growth (%)
- 1227.027027027027
- 2019 payment per patient
- 2953.0945945945946
- 2024 payment per patient
- 5083.704684317719
- Payment per patient growth (%)
- 72.14838609040959
- Certification date
- 08/31/2012
- Medicare spending per beneficiary, July 2026
- 1.02
- MSPB episodes
- 2409.0
- Quality stars, July 2026
- 3.0
- Completed surveys
- 172.0
- Survey response (%)
- 15.0
- Survey stars
- 3.0
- Survey recommendation (%)
- 77.0
- 2019 source row
- 1236
- 2024 source URL
- 2024 source row
- 1057
- Quality source row
- 1137
- Survey source row
- 1137
Nobilis Home Health Care $70,617 $1,417,026 1,906.6% - Provider ID (CCN)
- 553165
- Provider
- Nobilis Home Health Care
- City
- Glendale
- 2019 Medicare payments
- 70617
- 2024 Medicare payments
- 1417026
- Payment increase
- 1346409
- Payment growth (%)
- 1906.6357959131653
- 2019 Medicare patients
- 11.0
- 2024 Medicare patients
- 109.0
- Patient growth (%)
- 890.9090909090909
- 2019 payment per patient
- 6419.727272727273
- 2024 payment per patient
- 13000.238532110092
- Payment per patient growth (%)
- 102.5045298627965
- Certification date
- 12/08/2018
- Medicare spending per beneficiary, July 2026
- 1.16
- MSPB episodes
- 575.0
- Quality stars, July 2026
- 1.5
- Completed surveys
- 19.0
- Survey response (%)
- 19.0
- Survey stars
- —
- Survey recommendation (%)
- 60.0
- 2019 source row
- 1598
- 2024 source URL
- 2024 source row
- 1345
- Quality source row
- 1464
- Survey source row
- 8347
Dedicated Home Health Services, Inc $102,228 $1,996,636 1,853.1% - Provider ID (CCN)
- 559027
- Provider
- Dedicated Home Health Services, Inc
- City
- Los Angeles
- 2019 Medicare payments
- 102228
- 2024 Medicare payments
- 1996636
- Payment increase
- 1894408
- Payment growth (%)
- 1853.120475799194
- 2019 Medicare patients
- 14.0
- 2024 Medicare patients
- 207.0
- Patient growth (%)
- 1378.5714285714287
- 2019 payment per patient
- 7302.0
- 2024 payment per patient
- 9645.584541062803
- Payment per patient growth (%)
- 32.09510464342375
- Certification date
- 05/16/2019
- Medicare spending per beneficiary, July 2026
- 0.97
- MSPB episodes
- 737.0
- Quality stars, July 2026
- 2.5
- Completed surveys
- 36.0
- Survey response (%)
- 21.0
- Survey stars
- —
- Survey recommendation (%)
- 76.0
- 2019 source row
- 1741
- 2024 source URL
- 2024 source row
- 1495
- Quality source row
- 1631
- Survey source row
- 8514
Bliss Home Health Care, Inc $96,063 $1,526,390 1,488.9% - Provider ID (CCN)
- 553132
- Provider
- Bliss Home Health Care, Inc
- City
- Montrose
- 2019 Medicare payments
- 96063
- 2024 Medicare payments
- 1526390
- Payment increase
- 1430327
- Payment growth (%)
- 1488.9468369715707
- 2019 Medicare patients
- 15.0
- 2024 Medicare patients
- 126.0
- Patient growth (%)
- 740.0
- 2019 payment per patient
- 6404.2
- 2024 payment per patient
- 12114.20634920635
- Payment per patient growth (%)
- 89.16033773471082
- Certification date
- 09/28/2018
- Medicare spending per beneficiary, July 2026
- 0.96
- MSPB episodes
- 342.0
- Quality stars, July 2026
- 4.0
- Completed surveys
- —
- Survey response (%)
- —
- Survey stars
- —
- Survey recommendation (%)
- —
- 2019 source row
- 1572
- 2024 source URL
- 2024 source row
- 1323
- Quality source row
- 1440
- Survey source row
- 8323
New Dimension H C $76,687 $988,314 1,188.8% - Provider ID (CCN)
- 557685
- Provider
- New Dimension H C
- City
- Montrose
- 2019 Medicare payments
- 76687
- 2024 Medicare payments
- 988314
- Payment increase
- 911627
- Payment growth (%)
- 1188.7634149203907
- 2019 Medicare patients
- 21.0
- 2024 Medicare patients
- 117.0
- Patient growth (%)
- 457.1428571428571
- 2019 payment per patient
- 3651.7619047619046
- 2024 payment per patient
- 8447.128205128205
- Payment per patient growth (%)
- 131.3165103703265
- Certification date
- 04/24/1996
- Medicare spending per beneficiary, July 2026
- 0.89
- MSPB episodes
- 423.0
- Quality stars, July 2026
- 1.5
- Completed surveys
- 5.0
- Survey response (%)
- 19.0
- Survey stars
- —
- Survey recommendation (%)
- 48.0
- 2019 source row
- 1702
- 2024 source URL
- 2024 source row
- 1445
- Quality source row
- 1577
- Survey source row
- 8460
Joy Health Care Services $82,449 $1,041,034 1,162.6% - Provider ID (CCN)
- 058188
- Provider
- Joy Health Care Services
- City
- Stanton
- 2019 Medicare payments
- 82449
- 2024 Medicare payments
- 1041034
- Payment increase
- 958585
- Payment growth (%)
- 1162.639934990115
- 2019 Medicare patients
- 20.0
- 2024 Medicare patients
- 131.0
- Patient growth (%)
- 555.0
- 2019 payment per patient
- 4122.45
- 2024 payment per patient
- 7946.824427480916
- Payment per patient growth (%)
- 92.76945572368169
- Certification date
- 07/24/2003
- Medicare spending per beneficiary, July 2026
- 1.12
- MSPB episodes
- 478.0
- Quality stars, July 2026
- 2.0
- Completed surveys
- 13.0
- Survey response (%)
- 20.0
- Survey stars
- —
- Survey recommendation (%)
- 20.0
- 2019 source row
- 704
- 2024 source URL
- 2024 source row
- 647
- Quality source row
- 666
- Survey source row
- 666
Medco Home Health Care Inc $150,252 $1,868,007 1,143.2% - Provider ID (CCN)
- 553121
- Provider
- Medco Home Health Care Inc
- City
- Los Angeles
- 2019 Medicare payments
- 150252
- 2024 Medicare payments
- 1868007
- Payment increase
- 1717755
- Payment growth (%)
- 1143.2493411069404
- 2019 Medicare patients
- 15.0
- 2024 Medicare patients
- 124.0
- Patient growth (%)
- 726.6666666666667
- 2019 payment per patient
- 10016.8
- 2024 payment per patient
- 15064.572580645161
- Payment per patient growth (%)
- 50.39306545648472
- Certification date
- 10/09/2018
- Medicare spending per beneficiary, July 2026
- 0.98
- MSPB episodes
- 572.0
- Quality stars, July 2026
- 4.0
- Completed surveys
- 12.0
- Survey response (%)
- 9.0
- Survey stars
- —
- Survey recommendation (%)
- 72.0
- 2019 source row
- 1563
- 2024 source URL
- 2024 source row
- 1313
- Quality source row
- 1429
- Survey source row
- 8312
Constellation Home Health Services, Llc $102,834 $1,238,481 1,104.3% - Provider ID (CCN)
- 553137
- Provider
- Constellation Home Health Services, Llc
- City
- Northridge
- 2019 Medicare payments
- 102834
- 2024 Medicare payments
- 1238481
- Payment increase
- 1135647
- Payment growth (%)
- 1104.349728688955
- 2019 Medicare patients
- 26.0
- 2024 Medicare patients
- 116.0
- Patient growth (%)
- 346.1538461538462
- 2019 payment per patient
- 3955.153846153846
- 2024 payment per patient
- 10676.560344827587
- Payment per patient growth (%)
- 169.940456430283
- Certification date
- 07/24/2018
- Medicare spending per beneficiary, July 2026
- 0.88
- MSPB episodes
- 552.0
- Quality stars, July 2026
- 2.5
- Completed surveys
- 42.0
- Survey response (%)
- 27.0
- Survey stars
- 4.0
- Survey recommendation (%)
- 83.0
- 2019 source row
- 1576
- 2024 source URL
- 2024 source row
- 1328
- Quality source row
- 1445
- Survey source row
- 8328
Amberkare Home Health, Inc $76,493 $851,489 1,013.2% - Provider ID (CCN)
- 553131
- Provider
- Amberkare Home Health, Inc
- City
- Brea
- 2019 Medicare payments
- 76493
- 2024 Medicare payments
- 851489
- Payment increase
- 774996
- Payment growth (%)
- 1013.1593740603715
- 2019 Medicare patients
- 17.0
- 2024 Medicare patients
- 119.0
- Patient growth (%)
- 600.0
- 2019 payment per patient
- 4499.588235294118
- 2024 payment per patient
- 7155.36974789916
- Payment per patient growth (%)
- 59.02276772291022
- Certification date
- 10/15/2018
- Medicare spending per beneficiary, July 2026
- 1.12
- MSPB episodes
- 382.0
- Quality stars, July 2026
- 2.0
- Completed surveys
- 26.0
- Survey response (%)
- 29.0
- Survey stars
- —
- Survey recommendation (%)
- 51.0
- 2019 source row
- 1571
- 2024 source URL
- 2024 source row
- 1322
- Quality source row
- 1439
- Survey source row
- 8322
Agency finances. CMS cost-report archives for 2023 and 2024; selected financial cells and agency comparison. Patient service income equals patient revenue minus operating expenses. Figures are agency-reported across payers; Sea Coast’s selected reports cover calendar years and were settled without audit.
California licensing and county oversight. CDPH All Facilities Letter 17-20 (October 6, 2017; option effective October 1). CDPH describes a private-survey option for initial California licensure, an application-approval step, submission of survey findings to CDPH and a six-month provisional state license after a passing survey. It reports district-office survey waits of three months to two years. Los Angeles County’s April 7, 2026 letters, pages 1–2, describe coordination concerns, survey authorization and missing case-outcome information.
California initial-licensing survey process. CDPH’s October 2017 licensing procedure documents the licensing stages and reported waiting period. Process records and source links; CSV. Annual use of each California survey route requires applicant-level CDPH records: facility and license identifiers, application and approval dates, initial licensing-survey date and organization, result and license-issuance date. These records are required to calculate a state-licensing usage rate.
California licensing process and sources Data Application Applicant Submit the application to CDPH; identify the selected organization if using the private-survey option. - Id
- application
- Stage
- Application
- Actor
- Applicant
- Requirement
- Submit the application to CDPH; identify the selected organization if using the private-survey option.
Application approval CDPH Review and approve the application before the applicant schedules the private licensing survey. - Id
- approval
- Stage
- Application approval
- Actor
- CDPH
- Requirement
- Review and approve the application before the applicant schedules the private licensing survey.
State survey route CDPH district office Conduct the initial state-licensing survey. CDPH reported waits of three months to two years in October 2017. - Id
- state-survey
- Stage
- State survey route
- Actor
- CDPH district office
- Requirement
- Conduct the initial state-licensing survey. CDPH reported waits of three months to two years in October 2017.
Private survey route ACHC, CHAP or The Joint Commission Conduct the initial survey for California licensure and send findings to the applicant and CDPH. - Id
- private-survey
- Stage
- Private survey route
- Actor
- ACHC, CHAP or The Joint Commission
- Requirement
- Conduct the initial survey for California licensure and send findings to the applicant and CDPH.
Provisional license CDPH After a passing private initial survey, issue a six-month provisional state license. - Id
- license
- Stage
- Provisional license
- Actor
- CDPH
- Requirement
- After a passing private initial survey, issue a six-month provisional state license.
Warning to California licensing officials. California State Auditor, report 2021-123 (March 29, 2022), section on verifying hospice applications. A private survey organization reported a fabricated-address concern; CDPH issued the hospice license without resolving it. The finding concerns the state’s handling of a licensing warning.
California Medicaid fraud enforcement. HHS Office of Inspector General, annual MFCU statistical charts: 2018, 2019, 2020, 2021, 2022, 2023, 2024, 2025. California row, fraud-indictment and fraud-conviction columns (F7 and I7). Fiscal years; fraud category. Reporting definitions define charges by persons and entities and count convictions at sentencing. Abuse and neglect categories are separate. Percentage changes are calculated from the annual counts. Download all annual values and source locators. Federal health-care-fraud trials and outcomes. DOJ Fraud Section / White Collar Section annual reviews: 2018, 2019, 2020, 2021, 2022, 2023, 2024, 2025. Health Care Fraud Unit, calendar years, including opioid-related prosecutions. Historical trial counts for 2018–23 appear on PDF page 22 of the 2023 review; 2024 and 2025 statistics appear on PDF page 6 of their respective reviews. Convictions here combine guilty pleas and individuals convicted at trial. The reports may include previously sealed matters when they are unsealed. The downloadable dataset in note 8 provides page locators for each year.